The software allows checking the usage time of applications used according to whether they are configured as productive or non-productive, for the selected time period and user or group in the filter. Employees themselves can also propose applications that are initially marked as non-productive for their manager or supervisor to review and approve/deny.
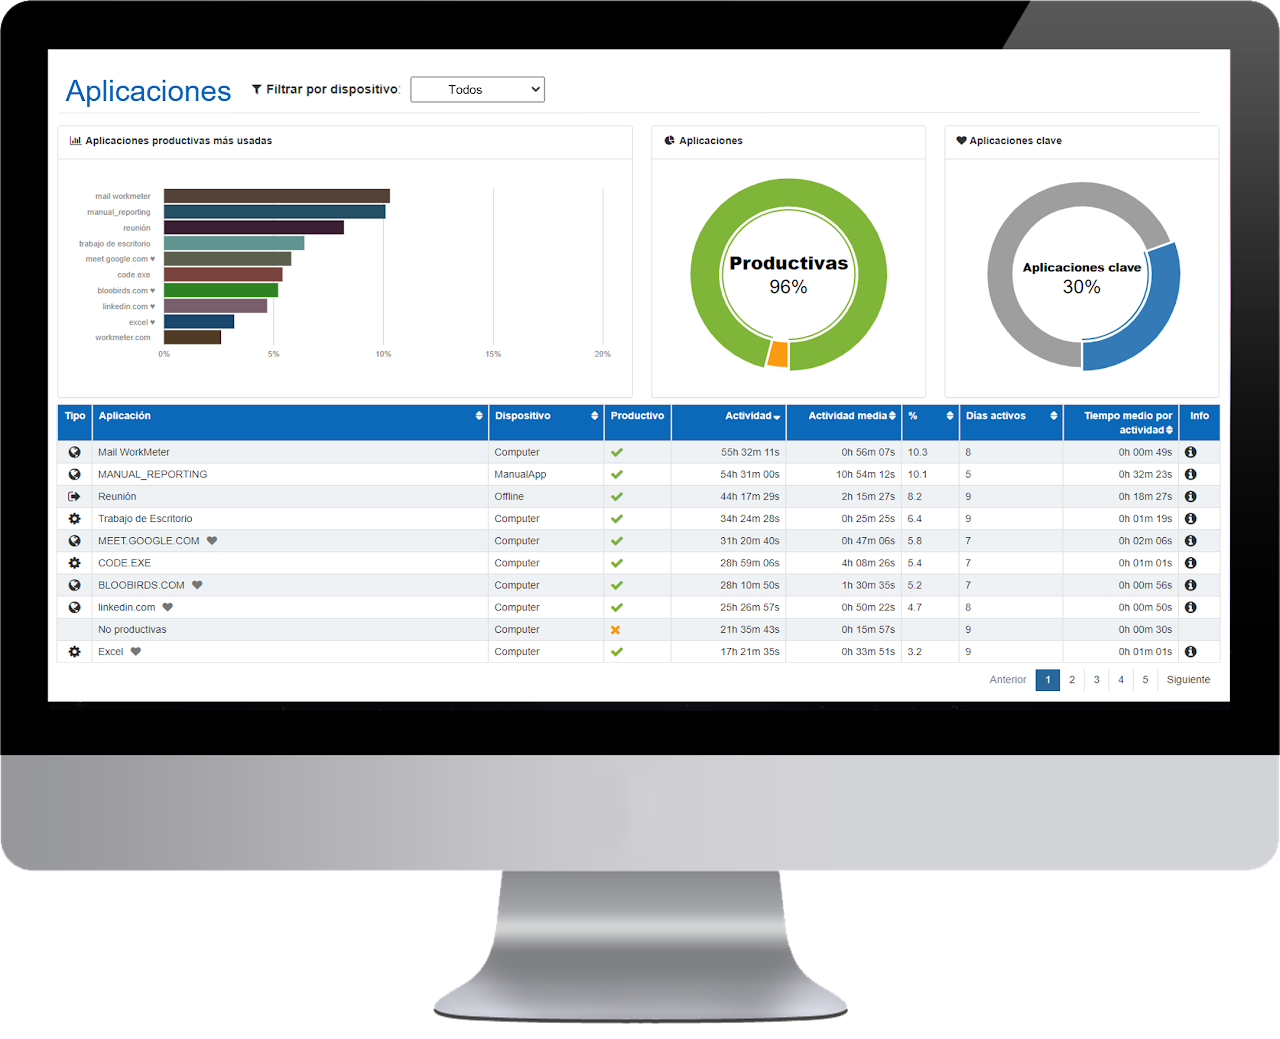
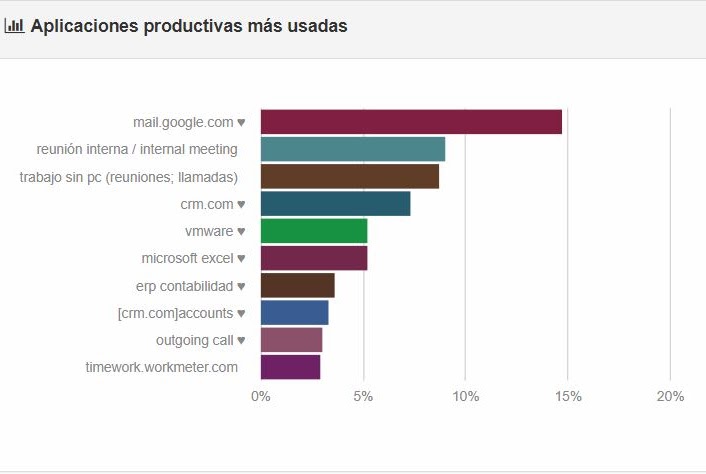
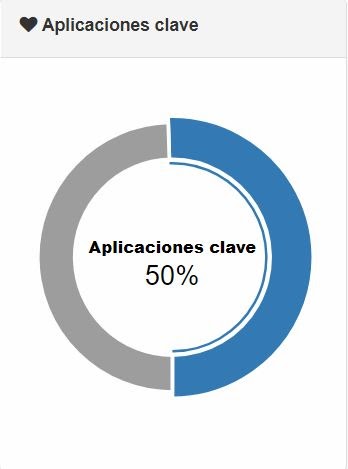
The first chart you will see on this panel shows a summary of the 10 most used applications for the selected time period and user or group. The second chart shows the percentage of productive applications used over the total activity. If you move the mouse over the yellow area of the chart, you will see the percentage represented by non-productive applications.
The administrator or supervisor will not be able to see the details of non-productive activities, thus preserving employee privacy. Only the employee with access can see the details of their non-productive applications and see which applications they spend their time on.
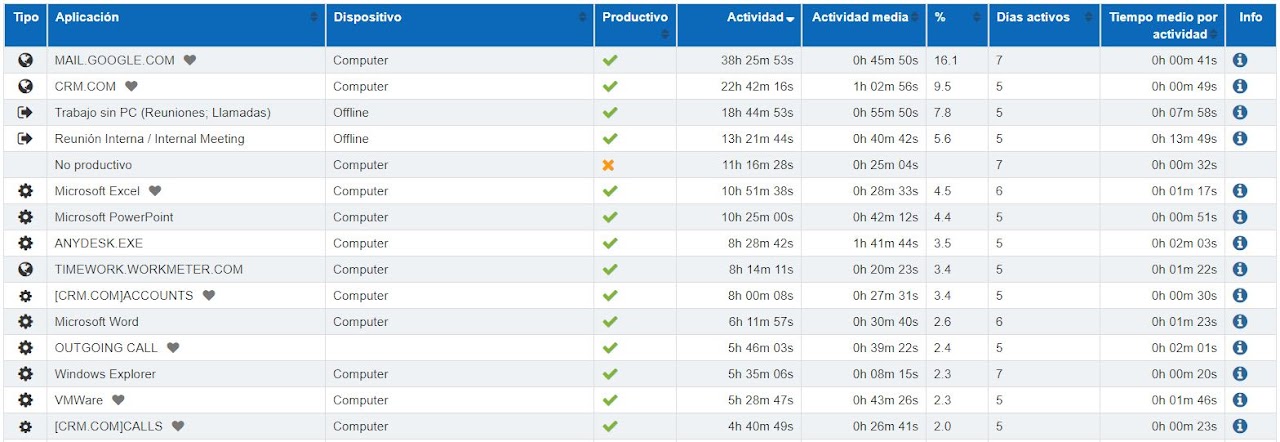
- The first column shows the type of application: whether it is a program, a website, or an offline activity
- Application: name of the application
- Device: device where the application was run (meetings and calls are shown as offline activity)
- Productive: shows whether the application is considered productive or unproductive for the selected workgroup and time period in the date filter
- Activity: total user activity time for the entire selected period
- Average activity: daily average user activity for the entire selected period (active days column)
- %: percentage of the users' average daily usage time of the application for the entire selected period
- Active days: number of days users have reported activity during the selected period. This column allows you to easily see if an employee has worked every day or has been absent some days.
- Average time per activity: represents the employee's concentration capacity. It shows the average time users in this group have continuously stayed on an application.
- (i) : a new window opens showing a graphical detail of the application's usage, by day, by group, and by employee, for the period selected in the date filter
Application Usage Detail 🔗
You can access this window from the (i) icon that appears in the last column of the Applications panel table.
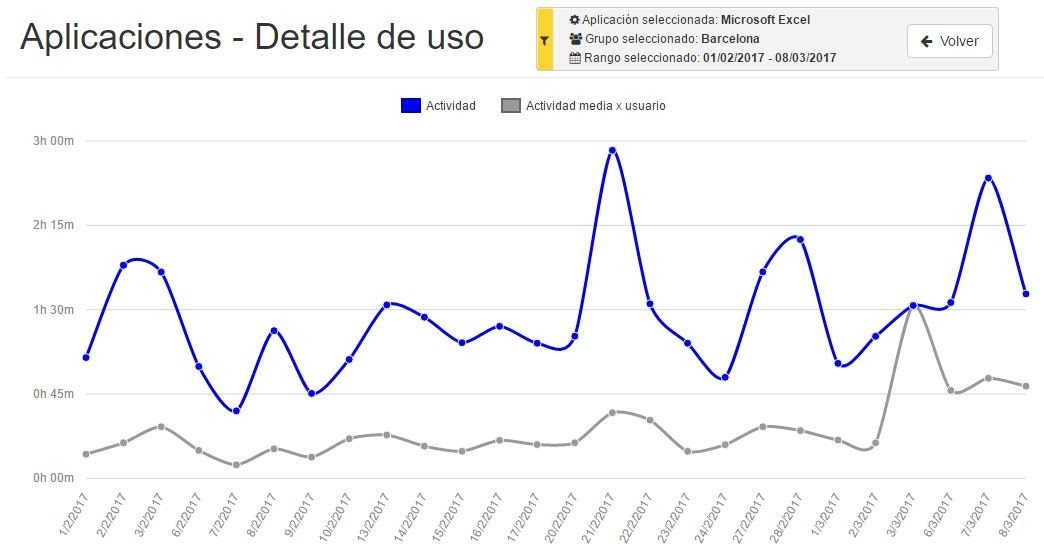
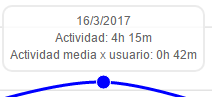
The chart shows, for the selected application, the total activity by days (blue color) and the average activity per user of the selected group (gray color). You can move the mouse over each point on the chart to see detailed information of both values for a specific day.
Just below the chart, you will see the same information represented in table format by days, by employee, and by work group.
Additionally, the table includes data on Average Time per Activity, which, if you recall, represents the average time users in this group have continuously spent on an application.
By groups, information on total productivity and average productivity of the users that make up the selected group is also included.
Proposal of productive applications by employees
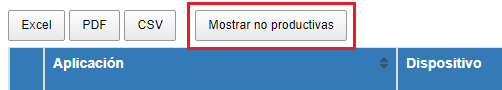
As we have already mentioned, the employee can see the details of their non-productive applications, and based on this information, they can make proposals to their managers to consider them as productive. To see their own non-productive applications, an employee must click the “ Show non-productive ” button located at the top of the summary table of all their applications.
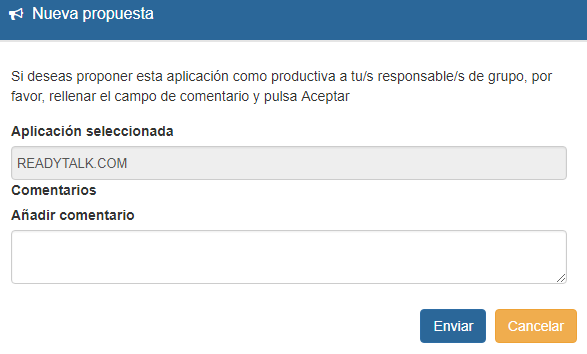
If the employee verifies that an application is considered non-productive but, however, believes it should be productive for the development of their job position, they can propose it as such by clicking on the icon.

In the next window, they can add a comment that their supervisor or manager will see in case they want to clarify in more detail why that application should be productive for their group.
Key Applications 🔗
We can differentiate the Key Applications from the rest of the Applications used in our organization. Additionally, the new diagram with the Key Applications will allow us to know the amount of time invested in them. These will also appear marked with a heart icon.

What are key applications? Key applications are those applications crucial for the daily work performance of the organization's workers. They differ from Productive Applications in that Key Applications are those intended solely for carrying out our daily work. For example, a calendar application could be a Productive Application, as it allows us to organize our time, but it would not necessarily be a Key Application, since it is not crucial for performing our work.
Online applications report 🔗

Key applications vs. remaining applications chart 🔗
This chart shows us the average active range time of each user for the selected period. If we hover over the gray band, we can see the average start and end times of the active range. By clicking on the blue part of the chart, we can directly access the details.
Key Applications - Usage Details 🔗
If we click on the Key Applications chart, we will access the Usage Details of them. We can view the application usage data either By day, By employee, By group, or through a Summary of all the above.
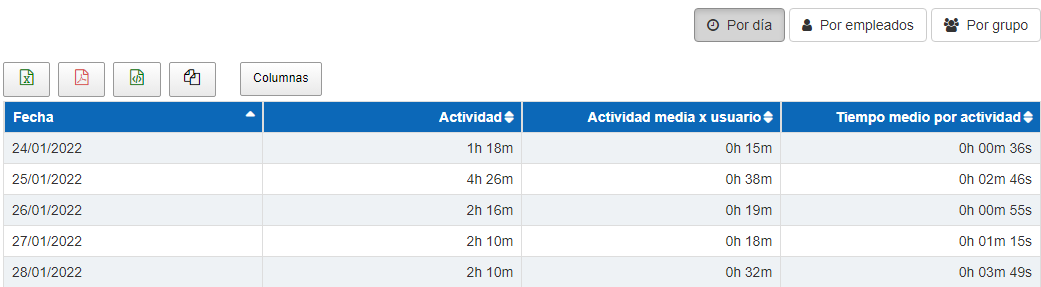
By day
- Here we will find a breakdown in four columns. The Date, which will show us a specific day, the total Activity of all workers that day, the Average activity per user of that day, and the Average time per activity of each user.

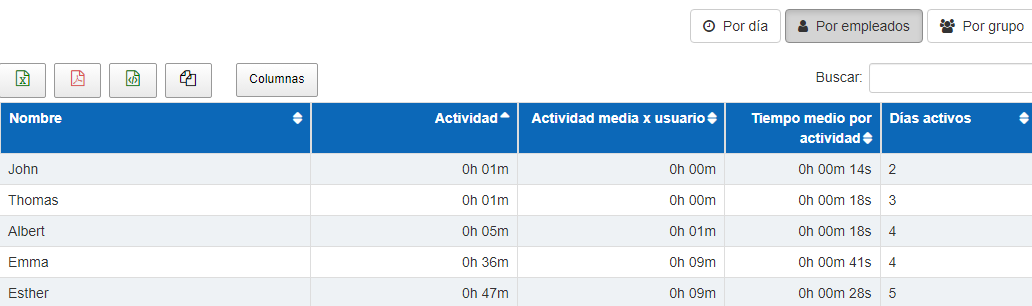
By employee
- Here we will find a breakdown in five columns. The employee's Name, the employee's total Activity, their Average activity, their Average time per activity, and the Days they have been active.

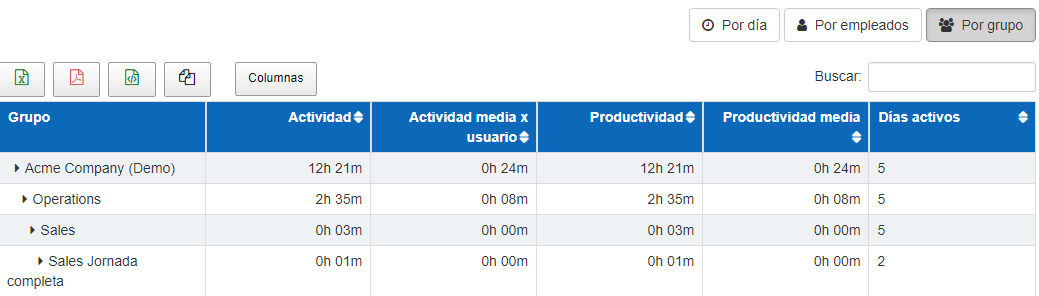
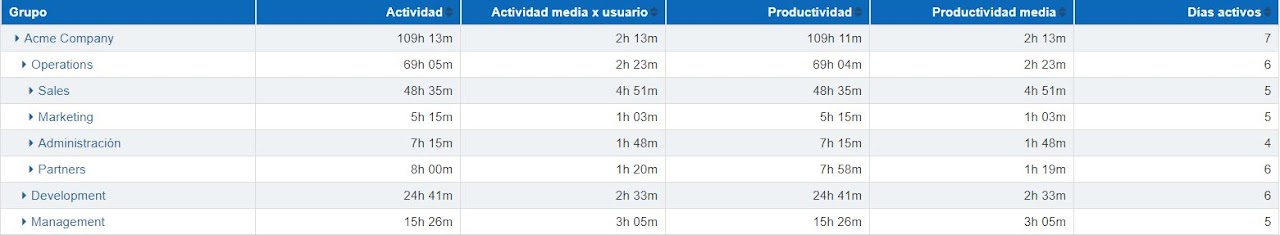
By group
- Here we will find a breakdown in six columns. The name of the Work Group, its Total Activity, the Average Activity per user in the group, the group's Total Productivity, the Average Productivity of each user in the group, and the Days the group has been active.
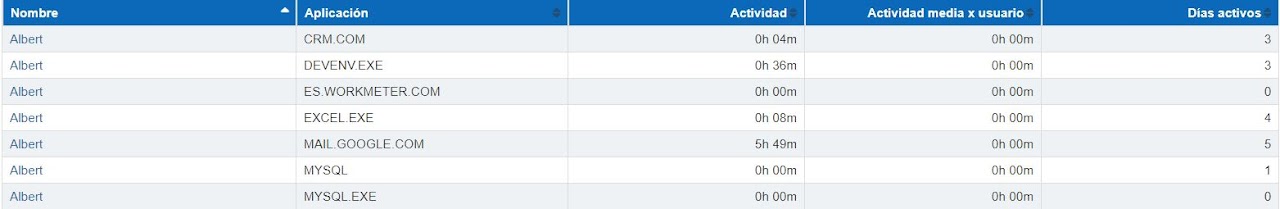
Summary
- Here we will find a breakdown in five columns of the key applications each user has used. We will find the User Name, the Application Name, the user's Total Activity in that application, the user's Average Activity in that application, and the Days the user has been active in each application.