Below you will find detailed help about the main panels that make up our software:
Date, Employees and Groups Filter 🔗
The date filter appears at the top right of the screen and allows you to select different date ranges. There are some predefined time periods that adjust automatically when selected. These examples are: today, yesterday, this week, last week, this month, and last month. To choose only a specific day, select the day you want as both the start and end date in the calendar range. If the date range is less than a day, the data will be shown in hours, and if the range is more than a day, it will be shown in days.
Employees are grouped into groups and subgroups; to see the data for a specific group, select it from this dropdown menu. From that moment, the values corresponding to all members of the selected group, as well as the employees of the subgroups dependent on it, will be displayed.
If you want to see the data for a particular employee, you can select them on the date filter, and upon selection, they will be highlighted in a different color with a “blinking” effect to indicate that the selection must be changed to continue.
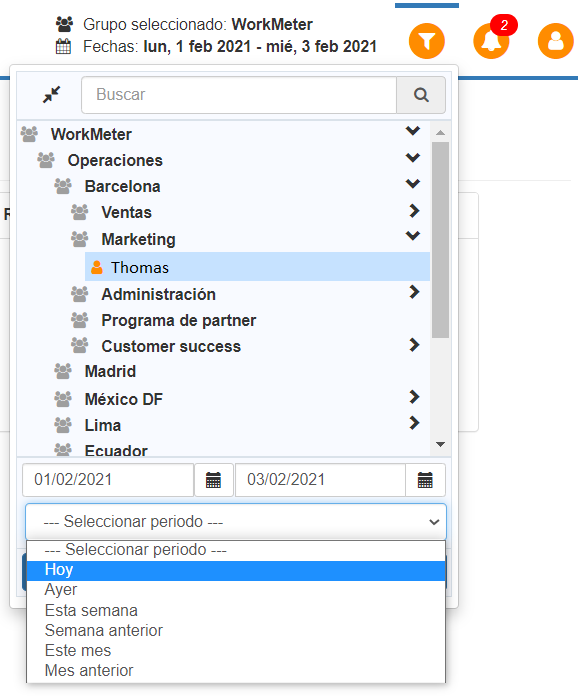
If you know the group to which the employee belongs, just click on the group name to list all its employees, allowing you to select the employee in question.
If you can't find the employee, you can search by typing their name in the search box. If there are multiple matches, you can choose among them.
Device filter 🔗
Data can be filtered by device type and according to the selected days. The data will appear updated when we click on "Apply filter".
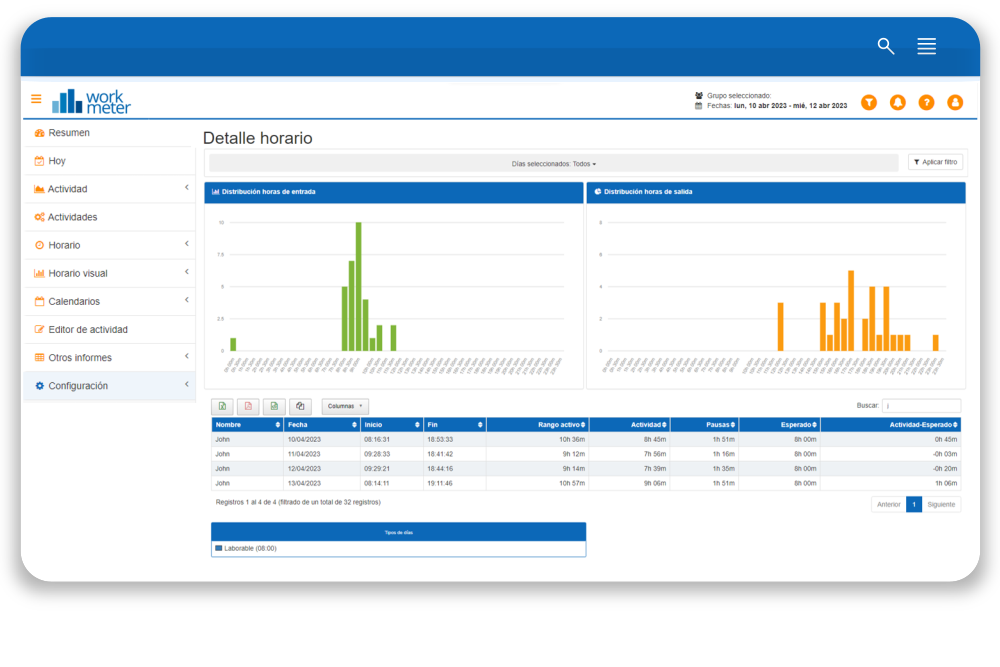
Data tables 🔗
In all panels where data tables appear, you will have the possibility to move columns and hide them to view the data you want in the desired order. The configuration you make will determine how the data is exported. If you want to move a column, drag it by the title. If you want to hide a column, click the Columns button and a list of fields you can hide or show will appear.
Below, you will find two videos that will teach you how to do it:
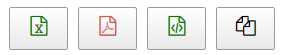
Data export 🔗
All panels have the possibility to export data in various formats: PDF, CSV, and Excel. When exporting to Excel, the data appears in hours and seconds. To convert them into hours, simply add a new column next to the data you want to convert and divide by 3,600.
To print a report for a specific employee, you should select that employee, the start and end date of the month in the filter, and export it to PDF.