The Summary panel is available to all employees. It includes a comparative chart showing how the main indicators vary between telework days and office days:
- Activity
- Productivity
- Focus (level of concentration)
- Time on PC

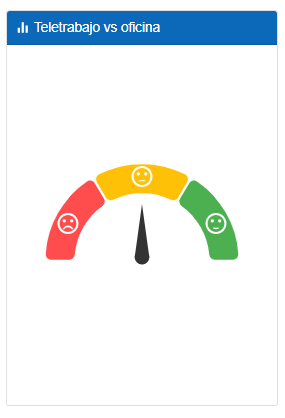
Additionally, it features a speedometer-type chart that summarizes the overall performance result in telework versus office work.
It shows whether these indicators improve, remain the same, or decrease during telework, using colors and emoticons to clearly reflect the situation of the team or each employee.
- Green → Indicates that telework performance exceeds the office average by more than +4%.
- Red → Indicates that telework performance is below -4% compared to the office average.
- Orange → Reflects an intermediate result, when the differences between telework and office are minimal.