Allows you to identify the days on which less than 4 0% of the expected uptime has been detected.
You can filter by employee or by group and see the incident details per employee.

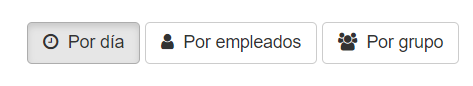
The data available in the table can be viewed by day, by employee, and by groups.
The solution automatically filters by the selected employee when accessing the incident details. You will be able to view the incident directly in the "Expected-Activity" column.
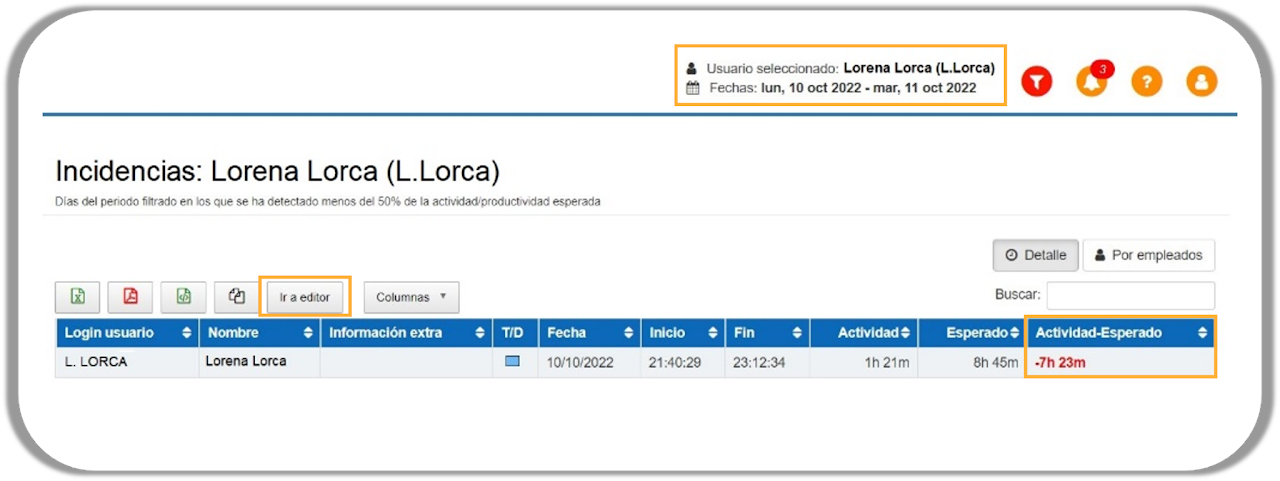
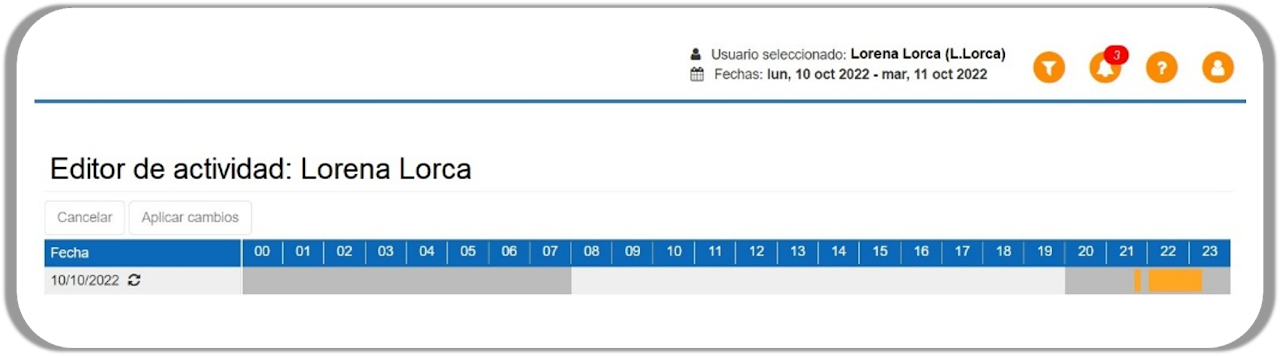
The incident detail panel has a button “Go to editor” that will allow you to go directly to the employee's "Activity Editor" panel, thus modifying and correcting the productive activity hours in the record or reviewing the reason for the incident.