In this panel, we show the reported activity in each work project and the percentage it represents of the total.
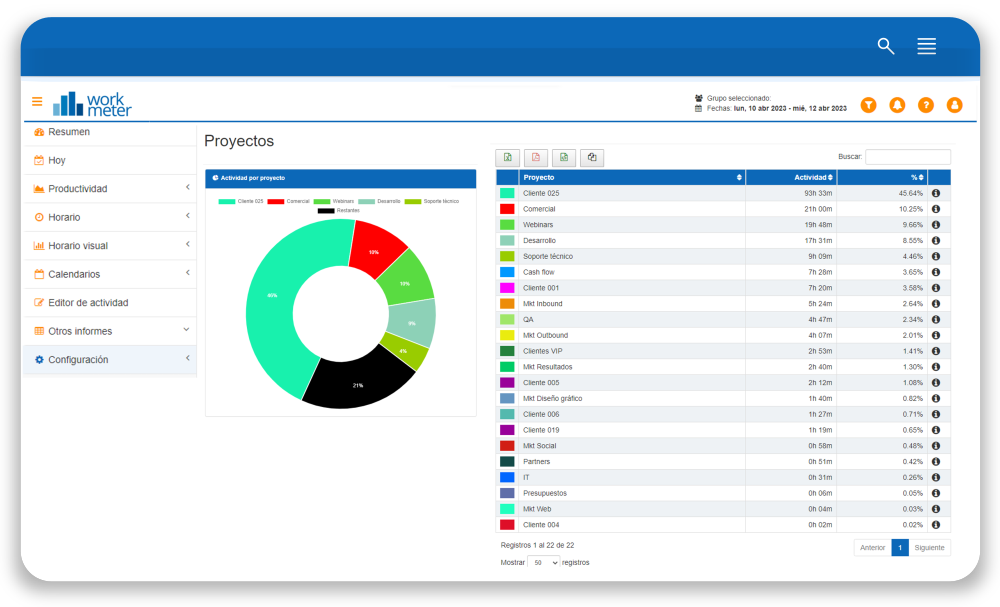
The “Activity by Project” panel is the first thing you will see when you enter the project management software. It shows a very visual summary of all your projects with information about the total activity recorded in each of them. It also displays a percentage of activity dedication over the total.
The panel provides information, in table and pie chart format, about:
- Project
- Total activity
- The percentage that each project's activity represents of the total
If we click on the (i) icon or on a color in the chart, a breakdown of activity for the selected project will open, by day, by task, by employee, or by work group.
Projects - Daily Usage Detail 🔗
In this panel, we show the daily activity of the selected project as well as daily average activity of that project.

- Date: specific day for the selected date filter
- Activity: total activity recorded in the project for the selected date filter and workgroup
- Average activity: daily average activity of the project for the selected days according to the number of employees (users column)
- Users: the number of employees who have reported activity in this project during the selected period
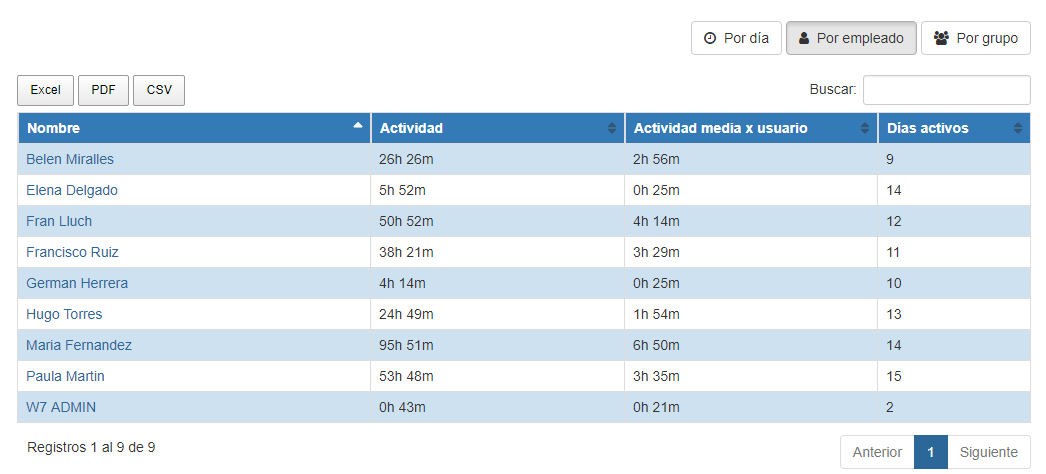
Projects - Usage Detail by Employee 🔗
In this panel, we show the total activity of the selected project for each employee as well as daily average activity
- Employee name
- Activity : total activity recorded in the project by the employee for the selected date filter
- Average activity : daily average project activity of employees for the selected date filter (active days column)
- Active days: the number of days the employee has reported activity in this project during the selected period
Projects - Usage details by group 🔗
This panel shows the total activity of the selected project by work group as well as daily activity averages
- Work group
- Activity : total activity recorded in the project by group for the selected date filter
- Average activity : daily average project activity by group for the selected date filter (active days column)
- Active days: the number of days the group has reported activity in this project during the selected period
- Users : the number of employees who have reported activity in this project during the selected period

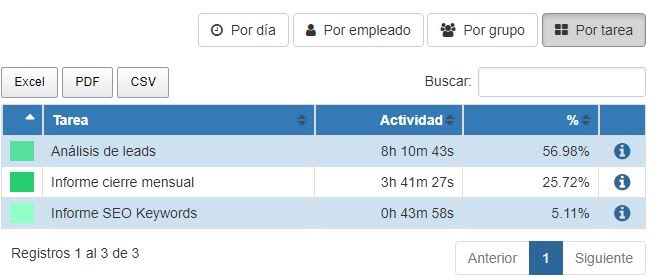
Projects - Usage Detail by Tasks 🔗
This panel shows the total activity of the selected project's tasks and the percentage they represent over the projects
- Task
- Activity: total activity recorded in the project's tasks/subtasks for the selected date filter
- %: percentage of activity that the task/subtask represents over the total projects