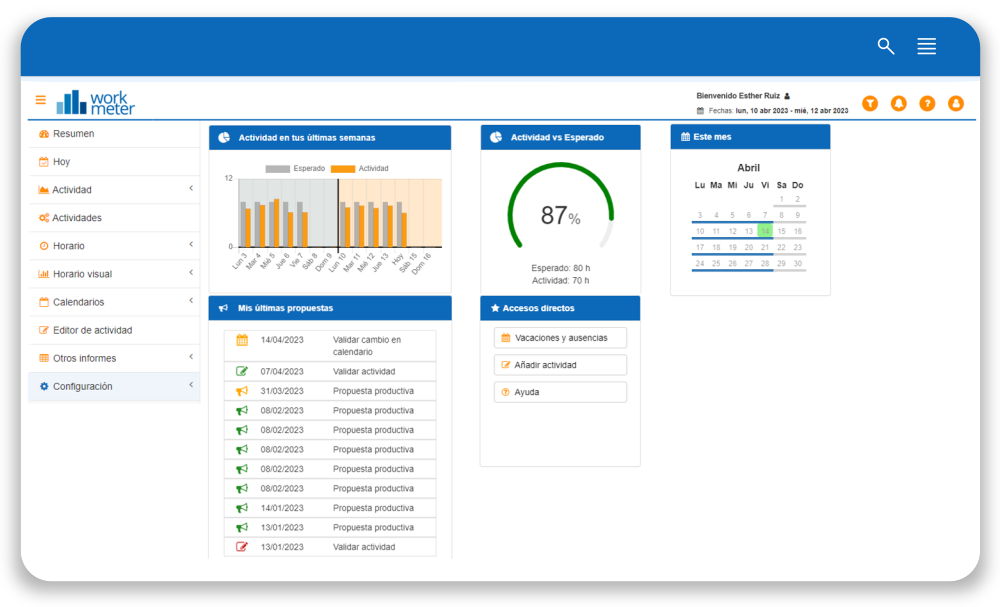
The “Summary” panel offers a dashboard with a customizable view. The user can choose the featured panels that are displayed when opening the application.
Panels can be removed, resized, and moved around the dashboard to suit the user's needs.
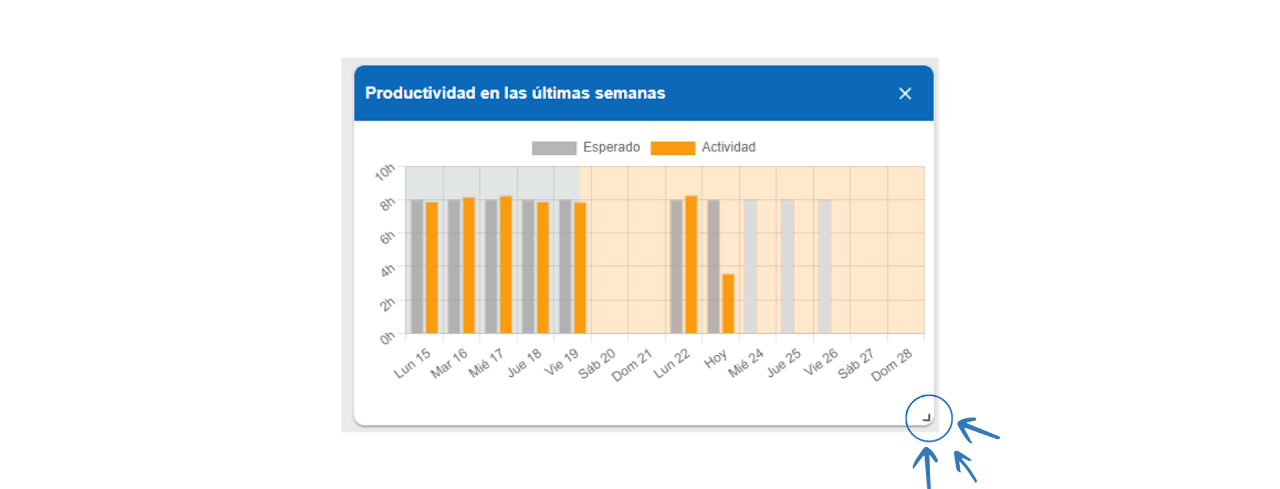
Note: The mark located at the bottom right of all panels appearing in “Summary” allows resizing the box according to the employee's preferences.
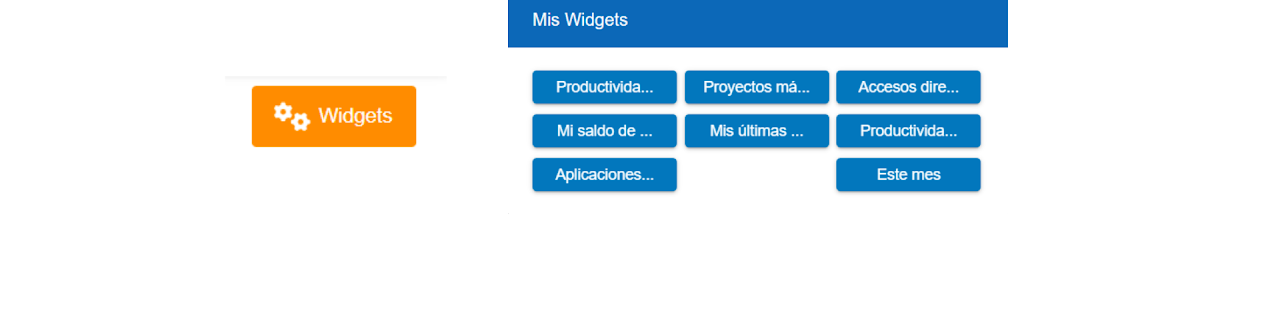
By clicking on the “Widgets” option, a pop-up window appears that allows removing or adding the sections shown by default on the dashboard.
In this dashboard, different widgets are shown by default depending on the user's permissions.
Employee Session 🔗
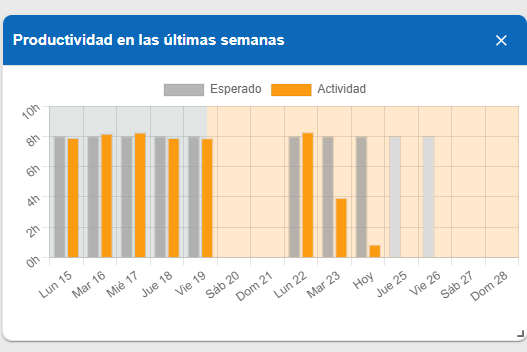
Productivity of the last weeks 🔗
The chart shows the expected activity and the actual activity, where it can be seen if the established schedule has been met or not. The panel is divided into hours (vertical) and days of the week (horizontal).
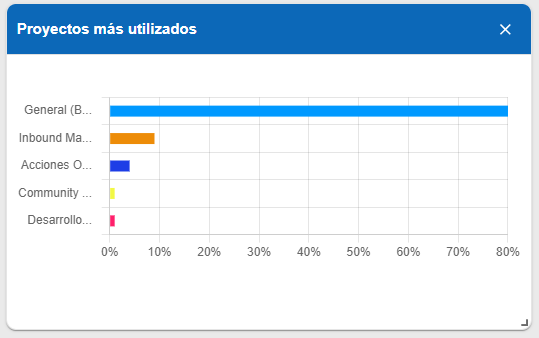
Most used projects 🔗
Chart showing the different projects you have worked on and the percentage of time spent on each.
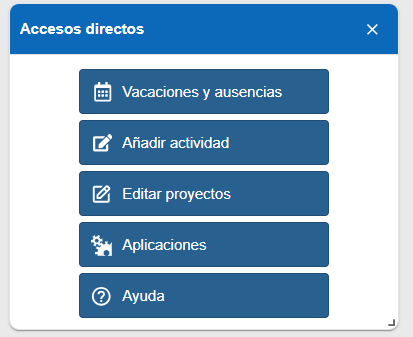
Shortcuts 🔗
- Vacations and absences. Quickly access your personal calendar.
- Add activity. Edit your workday activity.
- Edit projects. If you have the WorkMeter projects module, it will allow you to quickly access the panel to edit the time spent on specific projects.
- Applications. With one click, you can access the applications panel to analyze your performance and productive time.
- Help.
My day balance 🔗
Table showing the types of days corresponding to each employee, the total number of these, the consumed, and the remaining.
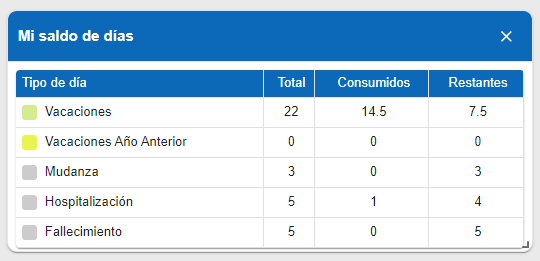
Note: Each company can configure the types and balance of days according to their needs and/or collective agreements.
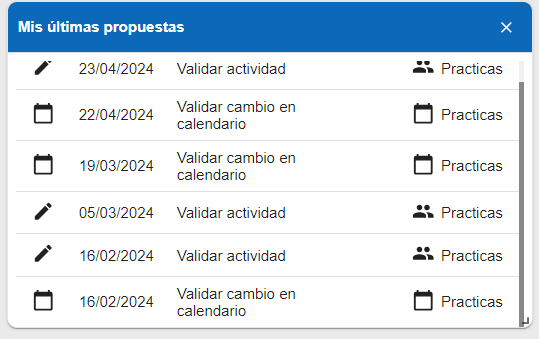
My latest proposals 🔗
Shows the proposals made by the employee and their status, that is, whether they have been approved or not.
Examples: Calendar change validation, activity validation, productive proposal…
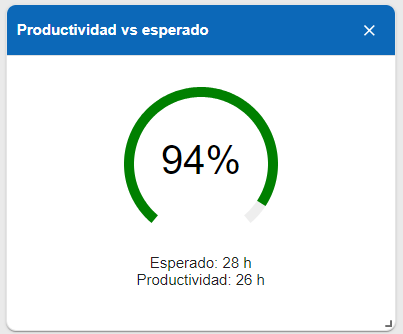
Productivity vs Expected 🔗
Percentage of actual activity over expected activity. Also represented in hours.
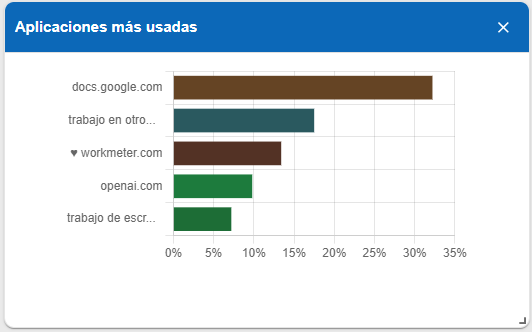
Most used applications 🔗
Chart showing the most used applications. Also represented in percentages.
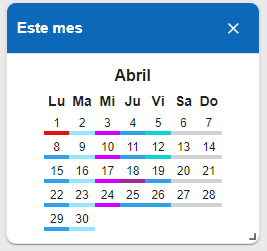
This month 🔗
Full month calendar showing the types of days by colors.
Administrator Session 🔗
In this dashboard we show you:
Shortcuts 🔗
- Validate calendar change: By clicking you will quickly access your notifications panel and see only the requests related to calendar changes, as the content table will be pre-filtered.
- Validate activity: You will also access the notifications panel but in this case you will see only the requests related to activity changes.
- Vacations and absences: It will allow you to access the group calendar with just one click, where you can view vacations, absences, and other types of days of the company’s or your group's employees.
- Incidents (Calendar): You can quickly access the incidents panel that shows those scheduling errors in employees' calendars. For example; people who have reported less working time, unjustified absences, etc.
- View clock-ins: It will allow you to quickly access the visual schedule panel by employees.
- Incidents (Productivity): You can quickly access the incidents panel that shows those scheduling errors in employees' productivity. For example: people who have reported less work productivity.
- Help.
- Reports.

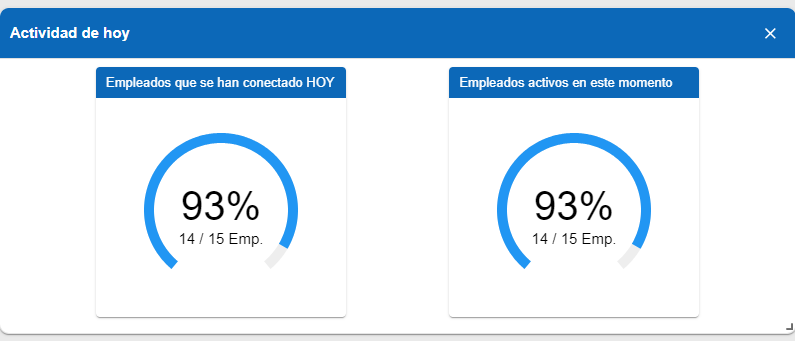
Today's Activity 🔗
- Employees who have logged in today: Total number of employees who have logged in and reported data during the current day.
- Employees currently active: Total number of employees who are logged in and reporting data at this moment.
Note: Clicking on the "Today's Activity" chart accesses the "Today" panel.
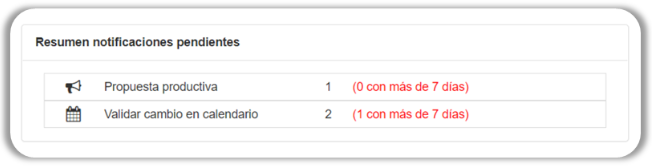
Notifications Summary 🔗
After a maximum of 25 days pending notifications will no longer be visible in this summary.
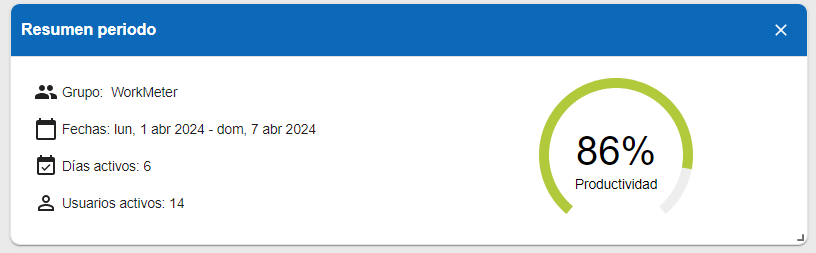
Period Summary 🔗
Summary of productivity levels over a period and in the selected groups.
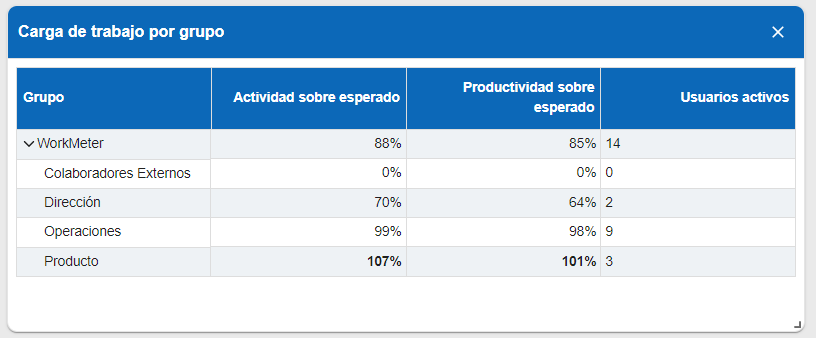
Workload by Group 🔗
- Percentage of activity and productivity over the expected divided by groups and departments.
- Active users also appear.
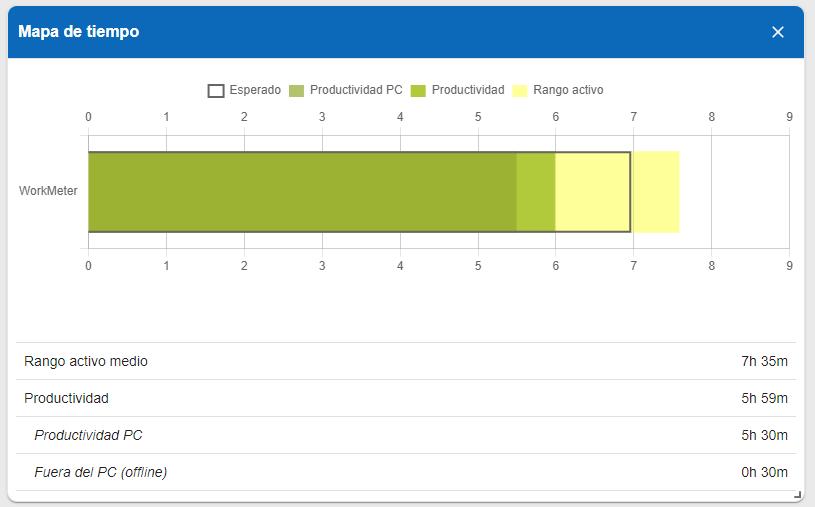
Time Map 🔗
It shows you a summary of the averages of the main time indicators collected by the software for the workgroup and the selected date range.
The chart allows you to visualize:
- The average active range time.
- The average daily activity.
- The part of the average activity corresponding to work on the PC.
- The part of the average activity corresponding to work off the PC.
- The average of the expected values of all subgroups included in the group.
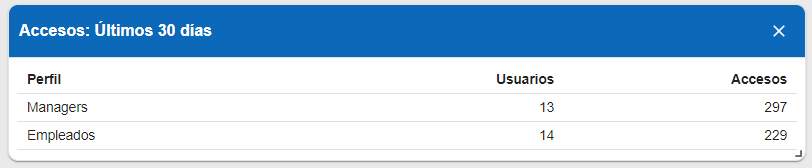
Access: Last 30 days 🔗
In “Summary" you will find a widget that shows how many managers and employees have accessed the application and the number of times they have done so in the last 30 days.