In Settings > Automation > Analyzer you can write in your own words what you want to know, for example "employees who start their shift after 10:00," and receive the report every day, every Monday, or on the 1st of each month. There is no need to create any report: you write the question and save it. WorkMeter shows you how it has understood it and you can test it with the last period.

Analyzers can be created by administrators, HR, and group managers with access to settings. A group manager only sees in their reports the employees of their groups (and the groups under them) and only the data from the dashboards they have in their profile; if their groups change, the next report will reflect the new ones. Managers who can only see aggregated data do not have the Analyzer. Each analyzer belongs to its creator: only you see your analyzers and their reports. You can have up to 10.
Create an analyzer 🔗
- Click New analyzer and give it a Name.
- In What do you want to know?, write the question in your own words.
- Choose the Frequency:
- Daily: every day, with data from the previous day.
- Weekly: every Monday, with data from the previous week.
- Monthly: on the 1st, with data from the previous month.
- Optionally check Do not save or send if there are no results and Receive by email.
- Click Validate and save. WorkMeter checks the question and, in a few seconds, saves it and shows you This is what I will do: which data the report is based on, from whom, what it filters, how it groups, and what it calculates. Review it: this is exactly what will run each time. If it does not understand it, it tells you why and does not save it.
- If your question mentions applications or employees, WorkMeter shows those that match and you choose which to include (up to 15 applications). If you change the selection, click Validate and save again.
- Click Test now to see the result of the last period, before or after saving.
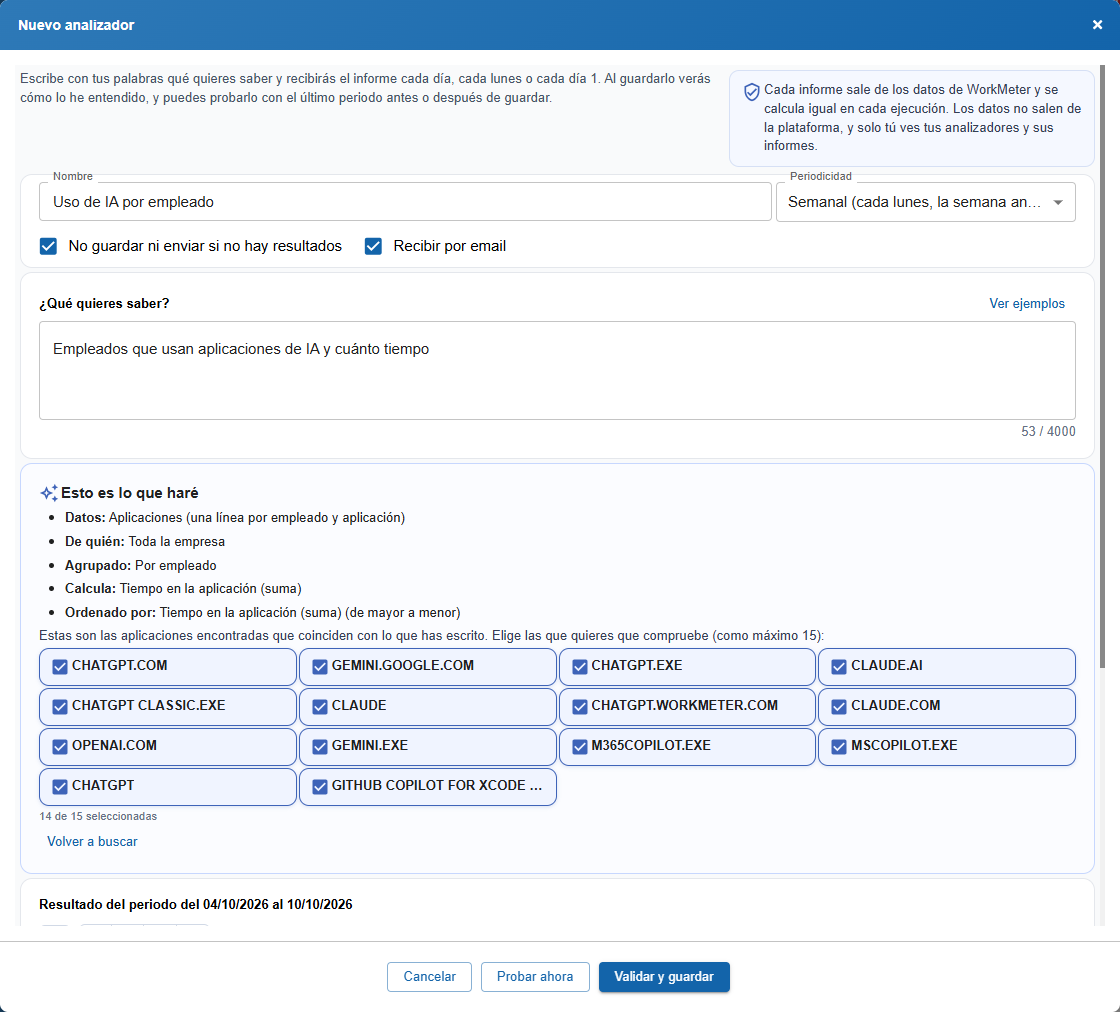
The Validate and save button remains disabled until you make a change. If you change the question, WorkMeter checks it again when you test or save it.
Examples:
- Employees who start their shift after 10:00.
- The 10 employees who work the least compared to their expected time.
- Who has done more than 2 extra hours in the period.
- Groups with less than 80% productive time compared to expected.
- Average daily time in the Office for each employee.
- Employees who use AI applications and how much time.
- Employees with pending notifications for more than 5 days.
- Projects with the most hours logged in the period.
The See examples button on the panel allows you to use any of them and adapt it.
Data you can use 🔗
Each analyzer extracts its data from one of these sources, depending on the modules in your account:
- Shifts: one line per employee and day (entry and exit time, worked and expected time, breaks, type of day, absences, telework…).
- Pending notifications: one line per unresolved request.
- Productivity: one line per employee with the total for the period.
- Applications: one line per employee and application.
- Projects: one line per employee and project.
The Available data dropdown on the panel shows all the data from each source. If your query needs data from two sources at once (for example, hours on a project and shifts of less than 8 hours), WorkMeter notifies you when checking that this report cannot be made.
Application groups: if your text talks about Office or AI applications, WorkMeter searches all their applications and websites (Word, Excel, PowerPoint, Outlook…; ChatGPT, Claude, Gemini, Copilot…) and then you choose which ones to use.
Reports 🔗
Analyzers run every night, according to their schedule.
- View reports: shows the list of runs, from newest to oldest. Each report can be viewed as a table, sorted by columns, downloaded in Excel or CSV, and deleted.
- If the report is a single figure (for example, “percentage of productive time for the entire company”), it is shown as a figure, along with the difference from the previous report.
- By email: if you check Receive by email, you receive a summary with the first lines and the full report attached in Excel. To receive it, you must have the option Receive email notifications enabled in My account.
- Reports are saved for 90 days.
Pause and delete 🔗
- Pause stops an analyzer without deleting it: it does not generate reports until you press Resume.
- Delete removes it permanently.
- If the last report of an analyzer fails (for example, because its creator no longer has permission to use the Analyzer, no longer sees the panel with that data, or the account no longer has the module it uses), you will see it marked as With error, with the cause in its reports. If it fails three times in a row, it pauses automatically: you will see it as Paused when activating Show paused, and you will receive an email notification.
Privacy: what you should keep in mind 🔗
- Inform the staff. An analyzer can generate lists with employee names and their application usage or work hours. According to article 87 of Organic Law 3/2018 (LOPDGDD), the company must have informed its employees about the criteria for using digital devices and how that use is monitored. Make sure the information you provide to your staff covers the reports you configure.
- The email attachment comes from WorkMeter. If you choose Receive by email, the Excel with the report data arrives in your mailbox, outside the platform. Treat it with the same confidentiality as any personal employee data and do not forward it to anyone who should not see it. If you do not want the data to leave WorkMeter, uncheck Receive by email and consult the reports in View reports.
- Each report is always calculated in the same way and with data from WorkMeter, which does not leave the platform (except the email attachment, if you choose it). AI only intervenes to check the text, to understand the question: it does not receive employees’ work hours, activity, or application data.