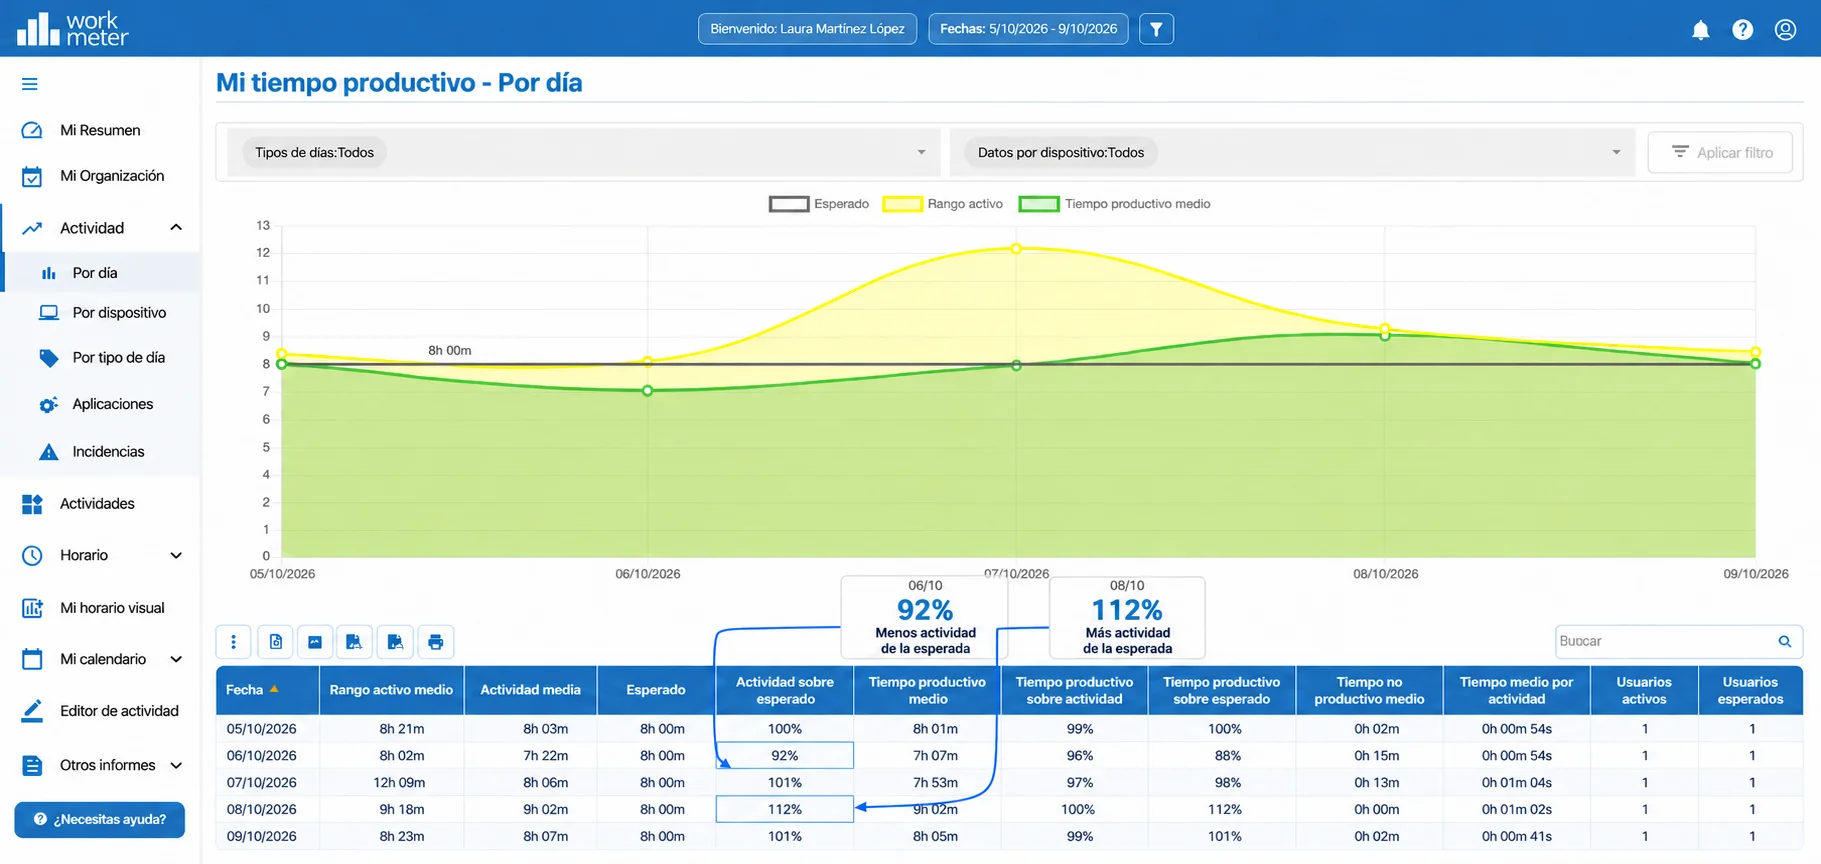
In this panel we show averages by employee group and breakdown of data by day
Remember that “activity” is the time spent interacting with the computer (online time) or tasks outside of it (offline time).
- Date
- Active range : average presence time of users included in the selected group
- Activity : total sum of activity hours of users in the selected group
- Average activity : daily average activity of the selected users
- Activity over expected (%) : level of achievement of the expected goal for the group. We calculate it by dividing the average activity of that group by the expected time.
- TMA (Average time per activity) : represents the employee’s concentration capacity. It shows the average time users in this group have continuously stayed in an application.
- Active users : number of users who reported activity that day and on whom all the previous averages are calculated.
Remember that you can sort the table values from highest to lowest and vice versa by clicking on the indicator you are interested in. You can also hide days without activity from the chart. You have the option at the top right of that chart by clicking on “ Hide days without activity ”.
Finally, you have the option to "Filter by device" if you want to show only the data collected by a specific device, such as only PC time, only offline time, only Android time, or only mobile APP time. By default, the information shows all devices.