Schedule - Summary by Employees 🔗
This panel shows the average of the selected days and the breakdown of data by employee.
- Name of the employee.
- Group to which the employee belongs.
- Active range: average daily presence time of this employee for the selected days.
- Breaks: average daily break time of this employee for the selected days.
- Activity: average daily activity of this employee for the selected days.
- Expected: the expected daily activity previously configured in the group to which the user belongs.
- Activity – Expected: obtained by subtracting the average daily activity minus the average daily expected. If the value is greater than 0, it indicates overtime hours worked by the employee. If the value is less than 0, it indicates the time the employee owes the company.
In this panel, we can also “group the data” so that only information from the groups is shown. If we group data instead of viewing user averages, we will see in the graph the 3 groups above the average and the 3 groups below the average.
- Group to which the employee belongs.
- Active range: average daily presence time of this group for the selected days.
- Break: average daily break time of this group for the selected days.
- Average activity: average daily activity of this group for the selected days.
- Expected: the expected daily activity configured for this group.
- Activity – Expected: average daily activity – average daily expected. If the value is greater than 0, it indicates overtime hours worked by the group. If the value is less than 0, it indicates the time the group owes the company.
In the “Summary by employee” panel table, you will now find absolute values for the period of activity, productivity, expected, and difference.
Schedule - Detail 🔗
In this panel we show daily totals and the breakdown of data by employees and days.
- Name of the employee.
- Date: specific day.
- Start: time of the first event of the day (usually the PC startup).
- End: time of the last event of the day (usually the PC shutdown or logoff).
- Active range: presence time. It is calculated by subtracting the start time from the end time.
- Activity: sum of PC activity hours and offline activity.
- Breaks: total time during which no activity was reported during the day.
- Expected: the daily expected activity configured in the group to which this user belongs.
- Activity – Expected: average daily activity – average daily expected. If the value is greater than 0 it indicates overtime hours worked by the employee. If the value is less than 0 it indicates the time the employee owes the company.
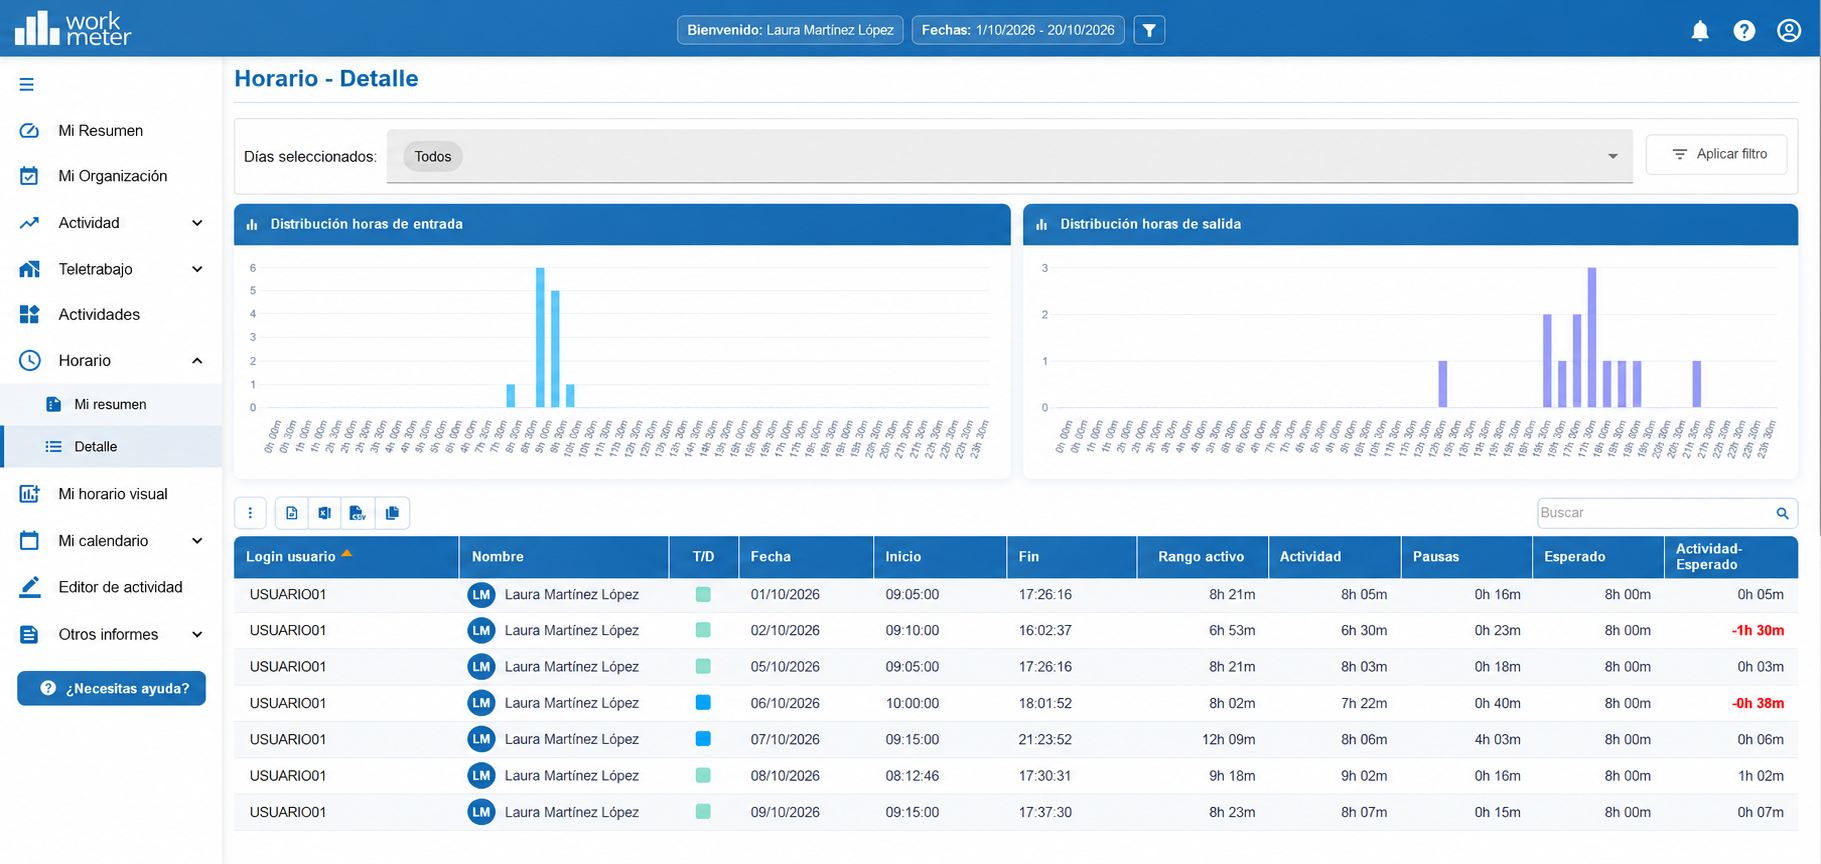
This panel is where you will find all the necessary information for preparing the monthly employee report required by the Labor Inspectorate.
As in all software panels, you can export this data in various formats (PDF, CSV, and Excel). When exporting to Excel, the data appears in hours and seconds. To convert them into hours, simply add a new column next to the data you want to convert and divide by 3,600.
To print a report for a specific employee, you should select that employee, the start and end date of the month in the filter, and export it to PDF.
Data visualization
It is now also possible to sort data by more than one column; you can do this by pressing the Shift key and the column headers you want to use for sorting. You can do this in all panels that have repeated sections such as HorarioDetalle.
Inside the “Detail” panel of the “Schedule” section, when filtering by an employee, it is now possible to view the total active time, breaks, and waiting time.
Visual schedule - By groups 🔗
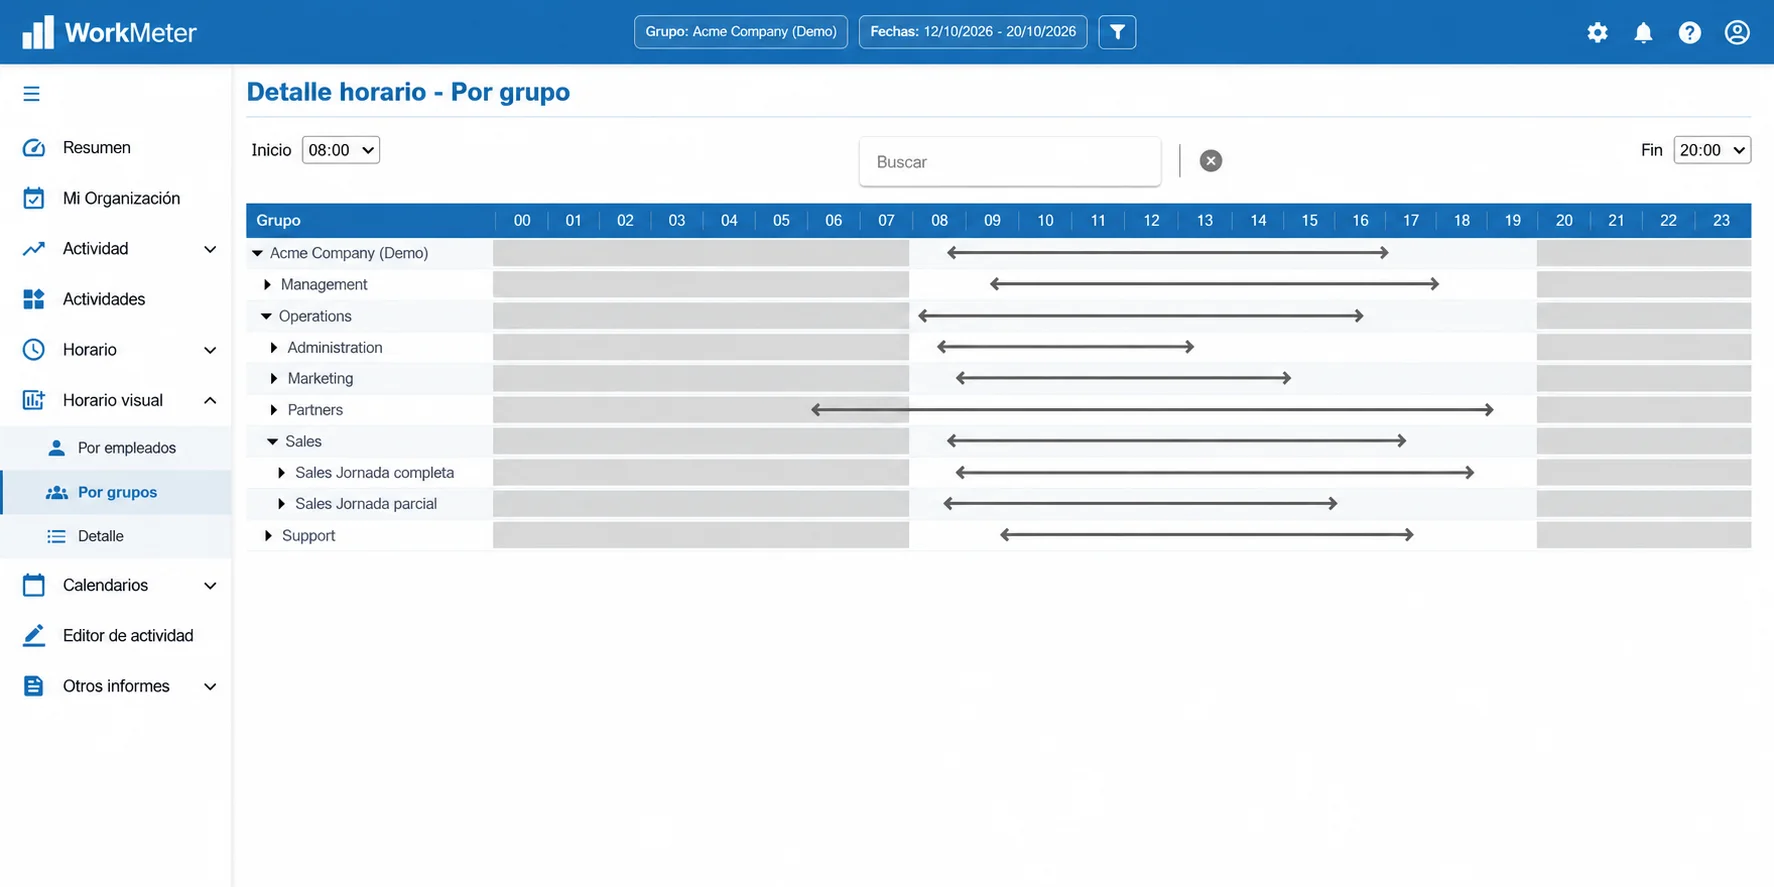
The tables contain expandable and collapsible sections to facilitate reading and understanding of the displayed data. Data can be expanded by group and subgroup, according to the information you want to view. You can also choose to see the active range of groups or work departments in your company.
Visual schedule - By employee 🔗
By clicking on the group of your interest, you can get the details of the employees who are part of the selected department.
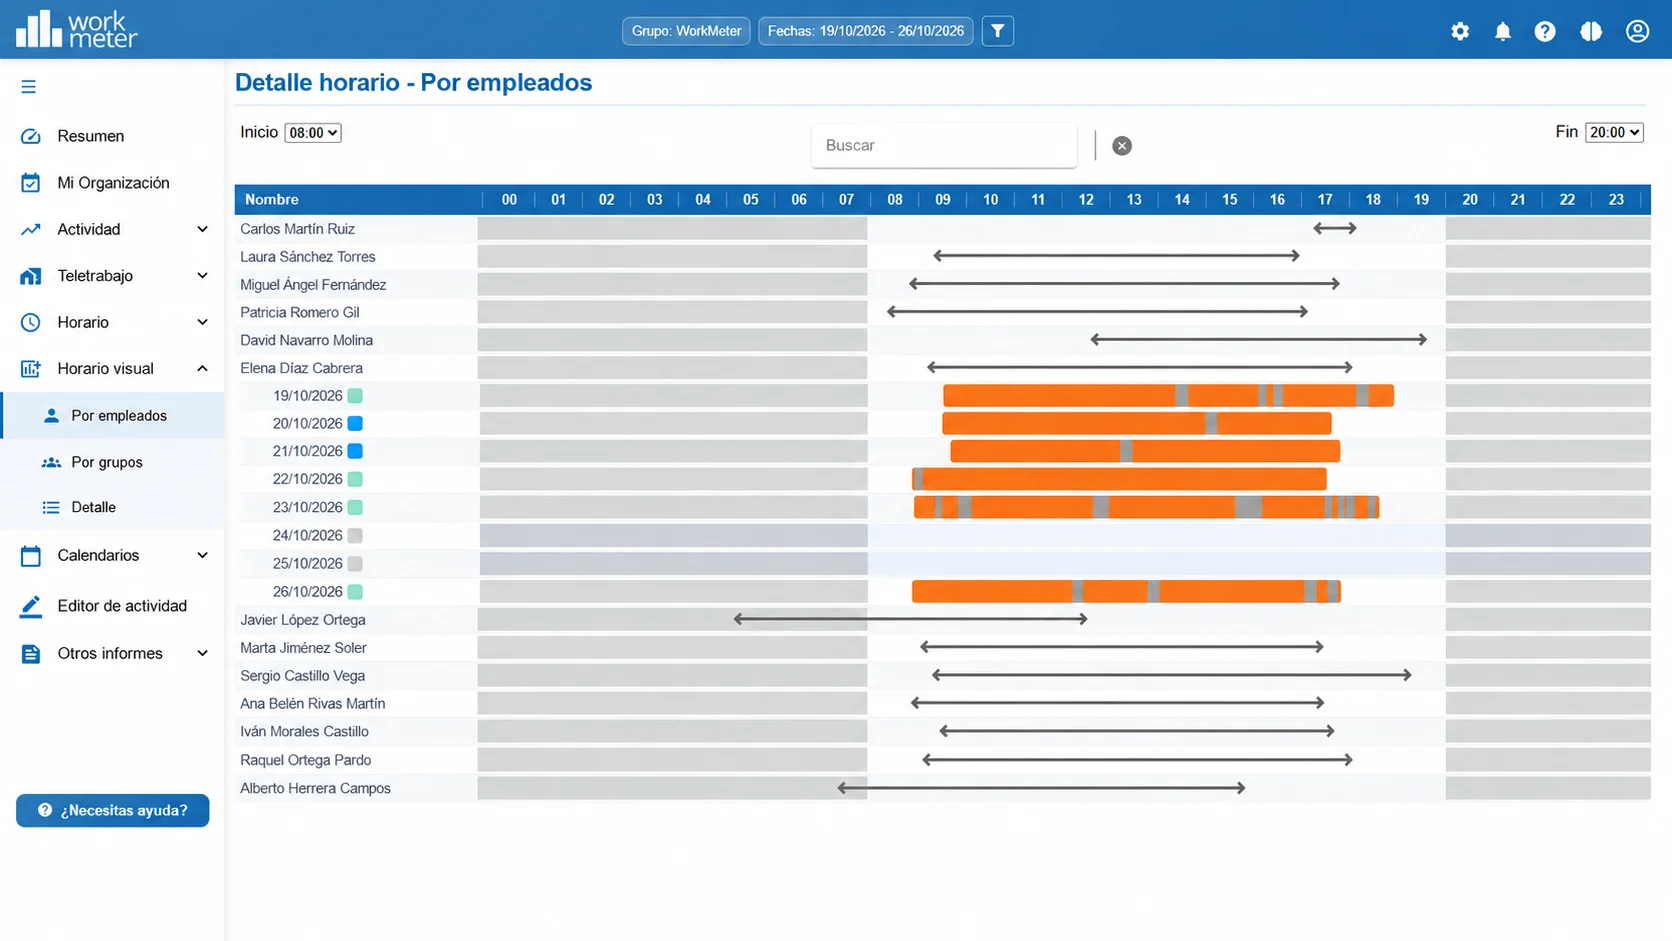
If you click on the gray line, the daily detail for that employee expands. Activity is shown in orange and detected breaks in gray. If you click again, the daily detail collapses again.
Visual schedule - Detail 🔗
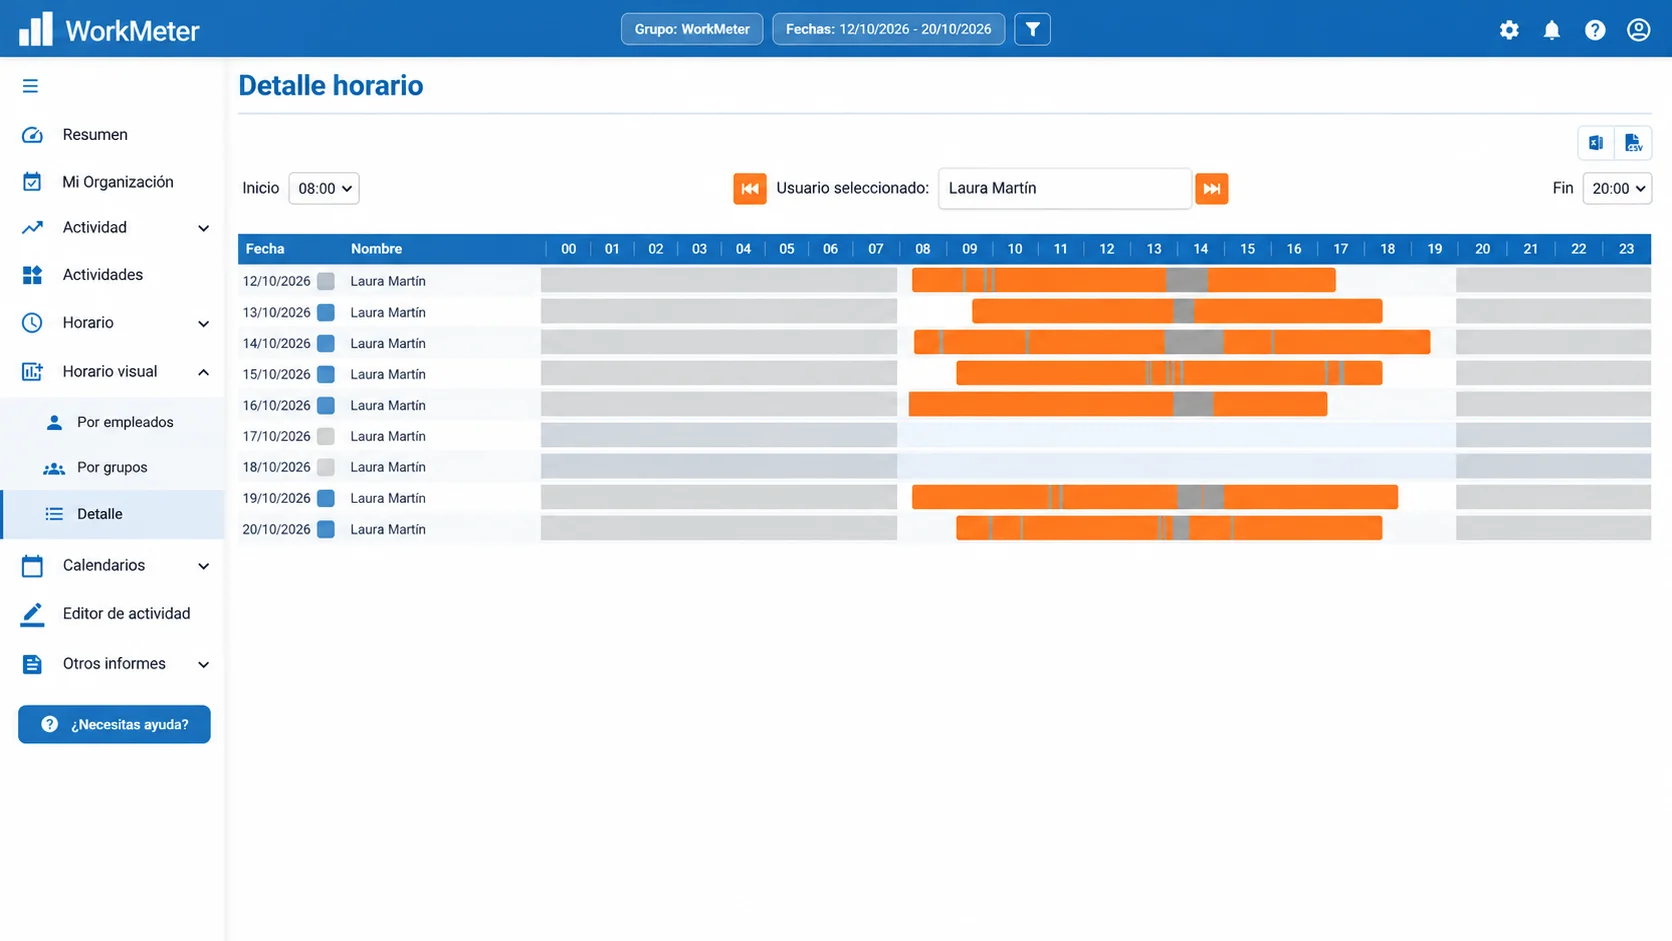
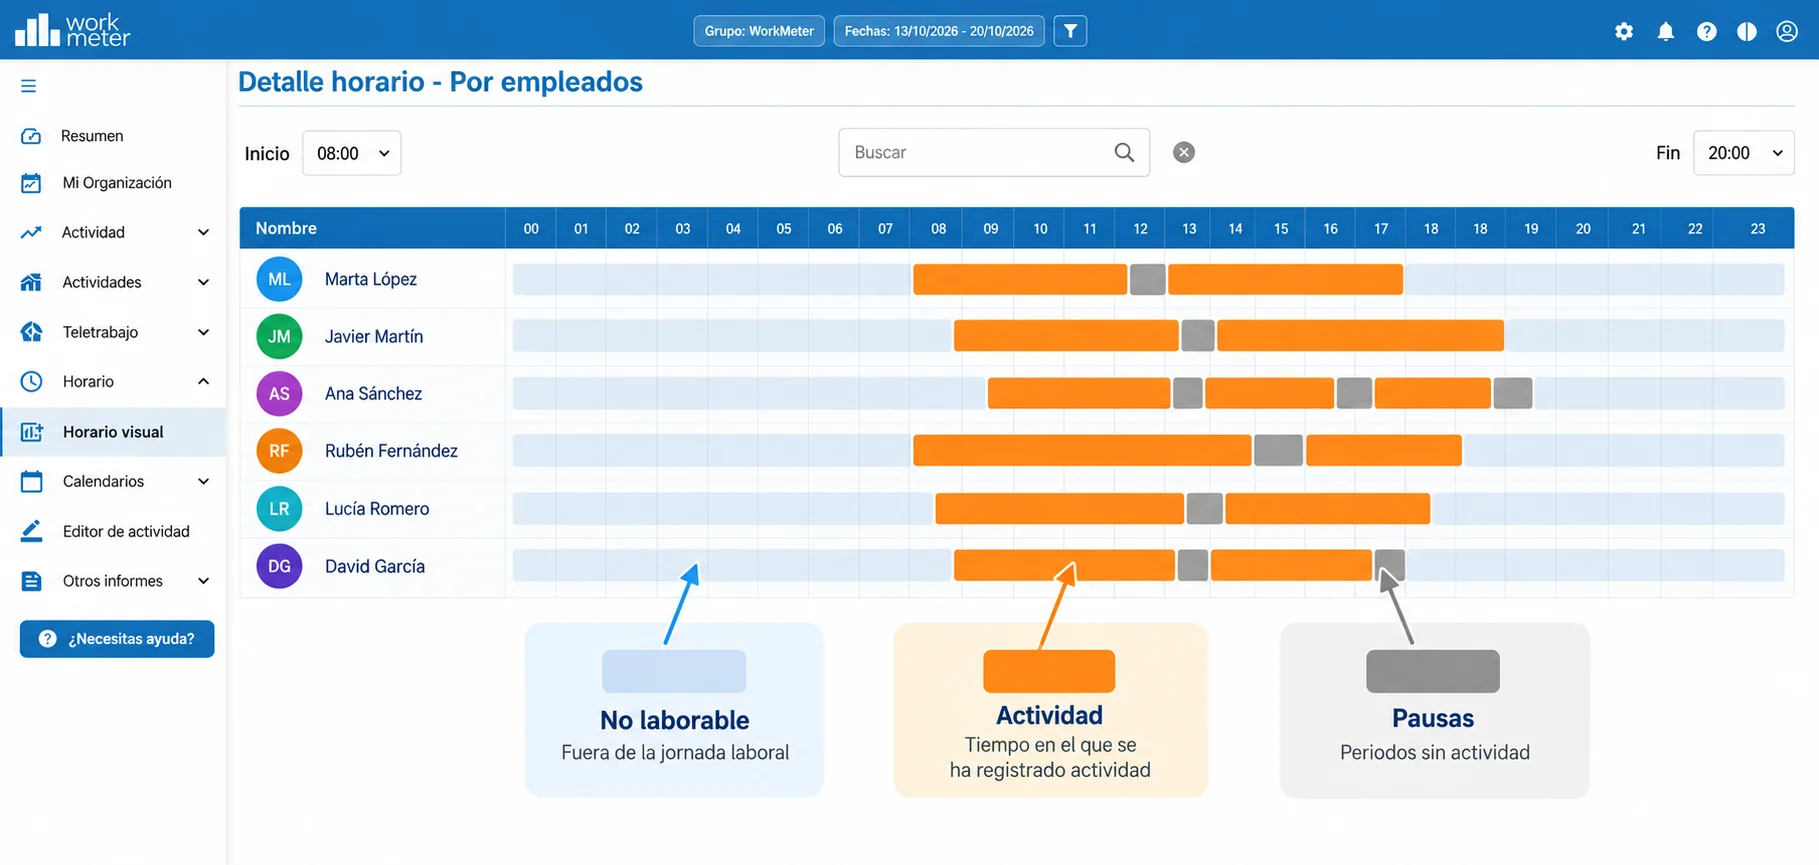
The graph shows day by day the start and end hours of the activity. Actual activity is shown in orange, breaks taken in gray, and weekend inactivity in light blue. The sum of both colors gives the total active range. Only breaks that exceed the minimum time considered as a break by the administrator (by default, 5 minutes) are shown.
The arrows allow us to move from one employee to another. We can also select the employee we want from the dropdown.